Yes. You can use Eclipse for debugging of JNI (c/c++) code. I personally prefer cgdb but if you want to debug in Eclipse here is how.
See my previous spot how to set up cgdb debugger if you think it will suit you.
See my blog spot how to set up Eclipse for compiling and editing C/C++ code.
0) Prerequisities
You need Eclipse with CDT installed.
See my previous spot how to do it.
You also need Android ndk. Download it from http://developer.android.com/sdk/ndk/index.html and unpack it somewhere.
1) In Eclipse open your Android project which contains C/C++ code that you want to debug.
For this tutorial I’ve created simple MyAndroidProject.
2) Set android:debuggable=”true”. Set android:targetSdkVersion=”9″.
android:debuggable is a property of <application> tag in your AndroidManifest.xml. You can set it either directly in xml or in Application tab as in the screenshot.

android:targetSdkVersion=”9″ is a property of <uses-sdk> tag in your AndroidManifest.xml. You can set it either directly in xml or in Manifest tab as in the screenshot.

3) Run your application in debug mode and try to run ndk-gdb from console
To run application in debug mode press debug button (green bug/spider button in toolbox). In console go to your project directory and run ndk-gdb. It should succeed. If it fails you have to resolve the problem. Running ndk-gdb does not only ensure us that we are doing everything right so far, but also creates app_process, gdb.setup and libc.so files in obj/local/armeabi/ subdirectory of our project. Those files will be needed in later steps.
4) Create C/C++ debug configuration
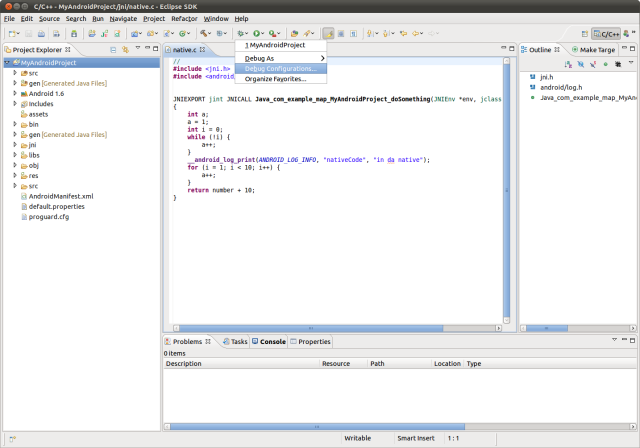
Click on combo-box like down arrow next to debug button. Pop-up menu will appear and then select Debug Configurations…
In Debug Configurations window select C/C++ Application and press New button as advised on the right pane.

5) Set name of the debug configuration, and fill information on Main tab.
Select Standard Create Process Launcher by clicking on the blue Select other… link at the bottom of the window.
In C/C++ Application entry fill the path to the app_process binary which is located inobj/local/armeabi/ subdirectory of your project.

6) Click on Debugger tab and fill information about debugger.
Choose gdbserver Debugger as a Debugger.
It’s good idea to set initial breakpoint to some function but Android projects do not contain main function so fill some appropriate function name in Stop on startup field (I filled Java_com_example_map_MyAndroidProject_doSomething but you can see only Java_com_exam on the screenshot).
Set path to GDB debugger. The debugger is distributed with the Android ndk. Its located at toolchains/arm-linux-androideabi-4.4.3/prebuilt/linux-x86/bin/arm-linux-androideabi-gdb.
Set path to GDB command line. This path should point to obj/local/armeabi/gdb2.setupfile inside your project. You don’t have gdb2.setup file there yet but you will create one in a while.

7) Click on the Connection tab (so you are in Debugger->Connection section of your C/C++ debug configuration) and fill information about connectinggdb with gdbserver.
Choose TCP as a type of connection and choose 5039 as a Port number.

8) Finally click Apply to save all the information about your C/C++ debug configuration.
This will save your new C/C++ debug configuration. Later, when running your application in debug mode you can choose in combo box associated with Debug button what debug configuration you want to use. Now you have two debug configurations. Android Java one which was created automatically for you when you’ve created Android project. And C/C++ one you’ve just created.
9) Go to the obj/local/armeabi/ subdirectory of your project and copygdb.setup file to gdb2.setup file. Remove target remote :5039 line fromgdb2.setup.
Eclipse don’t like target remote :5039 line in gdb setup file because it wants to enter this command internally (that is why you configured port 5039 in the previous step). Because the gdb.setup file is recreated by ndk scripts you have to copy it to the gdb2.setup and point Eclipse to the gdb2.setup file (we did this in step 6).
10) Go to the directory with Android ndk and copy ndk-gdb to ndk-gdb-eclipse. Remove execution of gdb command from ndk-gdb-eclipse.
Original content of ndk-gdb (Android NDK, r5):
578
579
580
581
| if [ -n "$OPTION_EXEC" ] ; then cat $OPTION_EXEC >> $GDBSETUPfi$GDBCLIENT -x `native_path $GDBSETUP` |
Content of ndk-gdb-eclipse:
578
579
580
581
| if [ -n "$OPTION_EXEC" ] ; then cat $OPTION_EXEC >> $GDBSETUPfi## $GDBCLIENT -x `native_path $GDBSETUP` |
Eclipse will run the gdb binary itself. So we have to remove the execution of gdb from ndk-gdb. To save original content it is good idea to copy the ndk-gdb to ndk-gdb-eclipse.
11) Now you are done. Put breakpoint in Java code after the execution ofSystem.loadLibrary() and start your application in Debug mode.
Start your application in debug mode by clicking on Debug button. It will automatically choose Android debug mode. Later you will have to take care to choose Android Java debugging configuration by clicking on combo arrow associated with the debug button.
The reason that breakpoint should be after System.loadLibrary() call is that our C/C++ code will be already loaded in that point and we can set breakpoints in it.
12) When execution reach the breakpoint run ndk-gdb-eclipse from your project directory and start debugging in C/C++ debug mode.
Go to the directory with your project and run ndk-gdb-eclipse. This will start server-part of the debugging infrastructure. Now click on the combo arrow associated with the debug button in Eclipse and choose Debug Configurations… Choose your C/C++ debug configuration and click Debug button.
The C/C++ debug configuration will be added to recently used debug configurations so later you don’t have to walk into the Debug Configurations… window again and you can choose between Android Java debug configuration and C/C++ debug configuration by just clicking on the combo arrow associated with debug button in Eclipse. However always make sure which debug configuration you are about to execute as this is where mistakes happen very often (at least for me).
After you’ve started C/C++ debug configuration click Resume button (or press F8). The application should resume its run and stop on C/C++ breakpoint (if you have one).
13) Now you are debugging the C/C++ code. Have fun!
Try to set some breakpoints in C/C++ code, etc.
Note on running ndk-gdb-eclipse
You have to run ndk-gdb-eclipse every time before starting C/C++ debug session. This script starts the gdbserver binary on device/emulator so gdb (run by Eclipse) can connect to it.
I made several attempts to force Eclipse to run ndk-gdb-eclipse script itself on start of C/C++ debug session. The most logical point is to write small script which will run ndk-gdb-eclipse without parameters (or with –force parameter) and then run gdb from Android ndk toolchain with all the parameters. This script can be used as GDB debuggercommand in the Debugger tab. But even if this script (and ndk-gdb-eclipse inside) was run successfully, the resulting connection of gdb and gdbserver always broke apart.
Final note and thanks!
This tutorial is heavily inspired by Sequoyah Project native debug tutorial. See http://www.eclipse.org/sequoyah/documentation/native_debug.php
Have Fun!
Không có nhận xét nào:
Đăng nhận xét