Hiển thị các bài đăng có nhãn NDK. Hiển thị tất cả bài đăng

Thứ Năm, 25 tháng 6, 2015

Will my Android App still run with ART instead of Dalvik?

With Android L, the virtual machine compiler will move to ART (Android RunTime) and only ART for 64 bit. So what do we know about ART vs Dalvik and what does it mean for App code?
ART is an  AOT (ahead of time) compiler meaning that dex2oat runs once, during the initial installation of the app. Dalvik was a JIT (just in time) compiler that ran only as the app was called.  In trade for a longer app installation time, ART frees up the processor later when the app is called.  Additionally a new garbage collector and memory allocators will reduce the number and duration of pauses meaning ART provides better responsiveness and less power draw.  But remember, the smaller memory footprint at runtime also means increased storage needs for the compiled binaries.   ART will work with ARM, x86, and MIPS hardware and show definite improvement running floating point calculations. 
So what changes to coding? Well, the good news is that ART is backward compatible, using the Dex (Dalvik executable) byte code format. So most apps should just run (and even run better). 
However, there are some things to be checked and optimizations that may be available:
  1. Check for ART by the value returned from  System.getProperty("java.vm.version"). ART is "2.0.0" or higher.
  2. If you use JNI to run C/C++ code, be sure to use CheckJNI (set debuggable="true" in the manifest).  See Debugging Android JNI with CheckJNI  (Note: this setting is for prerelease debugging and should not be set to true in the released code). 
  3. Get the latest versions of tools. ART does tighter bytecode verification at install time than Dalvik did. Code produced by the Android build tools should work but some post-processing tools (especially obfuscation tools) may produce invalid files (ok in Dalvik but rejected by ART.)
  4. Consider whether to remove some of the exception checks (which should no longer be needed since ART sees the whole code at once, but remembering that Dalvik will be around for some time.) 
  5. Remove most System.gc() calls, especially those for reducing GC_FOR_ALLOC-type occurrences or fragmentation.
  6. Don't save pointers to object instance data and don't pass a modified pointer to Release...ArrayElements()   The compacting garbage collector (already in AOSP) may move objects into memory and Get and Release calls to ArrayElements() could corrupt memory. If you make any changes to the returned array elements, you must call the appropriate function: 
    • No changes made to array > use JNI_ABORT mode, (release memory, no copy back).
    • Change(s) made, but don't need to reference them > use code 0 ( updates the array object and frees the copy).
    • Changes made and Need to commit  them >  use JNI_COMMIT (which updates the underlying array object and retains the copy).
  7. Don't attempt to look at the fields of  Object, since it now has private fields. When iterating up a class hierarchy as part of a serialization framework, stop when Class.getSuperclass()==java.lang.Object.class (don't continue until null is returned.) 
  8. Use the additional error handling  and logging in ART
    • Improved throwing and logging of NoSuchMethodError: from GetMethodID() and GetStaticMethodID()  and from
      RegisterNatives call  (caused pehaps because the method was removed by a tool such as ProGuard)
    • A  NoSuchFieldError (instead of null) from  GetFieldID() and GetStaticFieldID() 
    • A warning when subclasses try to override package-private methods.To override a class's method, declare the method as public or protected.
    • Other problems that are flagged by the ART verifier include:
      • invalid control flow
      • unbalanced moniterenter/monitorexit
      • 0-length parameter type list size
  9. Pay attention to the stricter JNI spec enforcement including that CallNonvirtual---Method() methods require the method to declare a class, not a subclass.  
  10. Watch the size of the ART unified Thread stack which should be about equal to the two Dalvik stacks (by default a 32 KB Java stack and a 1 MB native stack). Anywhere that the stack size is explicitly set needs to be checked - including Java calls to the Thread constructor including a size increase if StackOverflowError occurs.
  11. Watch pthread size (pthreat_attr_setstack() and pthreat_attr_setstacksize()as calls including AttachCurrentThread() will throw an error.
  12. Remove any dependencies on the installed .odex file format in /system/framework/data/dalvik-cache, or in DexClassLoader’s optimized output directory. While ART tries to follow the same naming and locking rules in ELF, apps should not depend on the file format. 
  13. Use the latest Mockito to correctly have Proxy InvocationHandler.invoke() receive null (instead of an empty array), if there are no arguments.
  14. Check any notifications you send. There's a new color scheme in Android L.
    • Use android.app.Norification.Builder.setColor() to set an accent color in a circle behind your icon image.
    • Remember to only use alpha only channels for the main notification icon and action icons
    • Check Heads up notifications (Those using fullScreenIntent, or high priority notifications with ringtone/vibrations)
References:
https://developer.android.com/preview/api-overview.html                                                                   

Thứ Hai, 22 tháng 6, 2015

Build FFMPEG in OSX


1.
Installing Autoconf, Automake, Libtool, Wget, Yasm:

 --- AutoConf --- 
curl -OL http://ftpmirror.gnu.org/autoconf/autoconf-2.69.tar.gz 
tar -xzf autoconf-2.69.tar.gz  
cd autoconf-2.69 
./configure && make && sudo make install 
 --- Automake ---
curl -OL http://ftpmirror.gnu.org/automake/automake-1.14.tar.gz 
tar -xzf automake-1.14.tar.gz 
cd automake-1.14 
./configure && make && sudo make install 
 --- LIBTOOL ---
curl -OL http://ftpmirror.gnu.org/libtool/libtool-2.4.2.tar.gz 
tar -xzf libtool-2.4.2.tar.gz 
cd libtool-2.4.2 
./configure && make && sudo make install
 --- WGET ---
 curl -O http://ftp.gnu.org/gnu/wget/wget-1.15.tar.gz  
tar -xzf wget-1.15.tar.gz  
cd wget-1.15
./configure --with-ssl=openssl && make && sudo make install
 --- YASM ---
curl -OL http://www.tortall.net/projects/yasm/releases/yasm-1.2.0.tar.gz 
tar xvzf yasm-1.2.0.tar.gz 
cd yasm-1.2.0 
./configure && make -j 4 && sudo make install
--- PKG-CONFIG && ANT ----

Install Macport before, link here: http://www.macports.org/install.php

+ PKG-CONFIG:
sudo port install pkgconfig 
export PATH=$PATH:/opt/local/bin

+ANT:
sudo port install apache-ant

--- Update NASM ---
Download Nasm 2.10.05 for mac here: http://www.nasm.us/pub/nasm/releasebuilds/2.10.05/macosx/
From where I downloaded the file
nasm-2.10.05-macosx.zip
Unzipping this file resulted in a directory named nasm-2.10.05 being created.

check current version: 
$ nasm -v
NASM version 0.98.40 (Apple Computer, Inc. build 11) compiled on Aug 4 2012

move to nasm-2.10.05 folder:
check version:
./nasm -v
NASM version 2.10.05 compiled on Sep 9 2012
I decided to put the downloaded nasm in a directory called prog/nasm inside my home directory. I moved it there using

mkdir -p ~/prog/nasm
mv * ~/prog/nasm
I then added the following changes

export PATH=~/prog/nasm:$PATH
to my setup script, where I also set up other environment variables. After having rerun the setup script I could use the downloaded nasm, after first having verified that it was found using

$ nasm -v
NASM version 2.10.05 compiled on Sep 9 2012
--- END ---

Thứ Tư, 3 tháng 6, 2015

Using Eclipse for JNI Debugging

Yes. You can use Eclipse for debugging of JNI (c/c++) code. I personally prefer cgdb but if you want to debug in Eclipse here is how.
See my previous spot how to set up cgdb debugger if you think it will suit you.
See my blog spot how to set up Eclipse for compiling and editing C/C++ code.
0) Prerequisities
You need Eclipse with CDT installed.
See my previous spot how to do it.
You also need Android ndk. Download it from http://developer.android.com/sdk/ndk/index.html and unpack it somewhere.
1) In Eclipse open your Android project which contains C/C++ code that you want to debug.
For this tutorial I’ve created simple MyAndroidProject.
2) Set android:debuggable=”true”. Set android:targetSdkVersion=”9″.
android:debuggable is a property of <application> tag in your AndroidManifest.xml. You can set it either directly in xml or in Application tab as in the screenshot.

android:targetSdkVersion=”9″ is a property of <uses-sdk> tag in your AndroidManifest.xml. You can set it either directly in xml or in Manifest tab as in the screenshot.


3) Run your application in debug mode and try to run ndk-gdb from console
To run application in debug mode press debug button (green bug/spider button in toolbox). In console go to your project directory and run ndk-gdb. It should succeed. If it fails you have to resolve the problem. Running ndk-gdb does not only ensure us that we are doing everything right so far, but also creates app_processgdb.setup and libc.so files in obj/local/armeabi/ subdirectory of our project. Those files will be needed in later steps.
4) Create C/C++ debug configuration
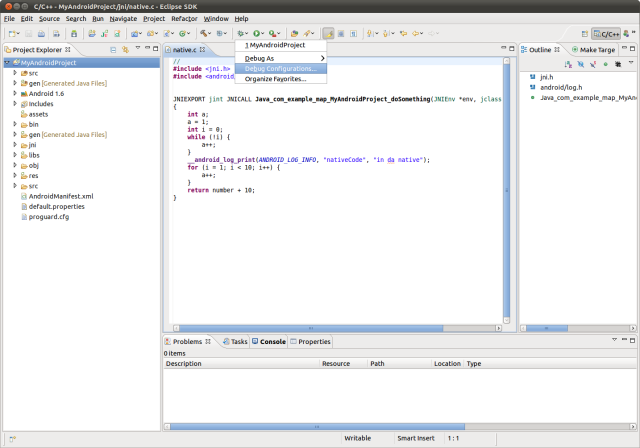
Click on combo-box like down arrow next to debug button. Pop-up menu will appear and then select Debug Configurations…


In Debug Configurations window select C/C++ Application and press New button as advised on the right pane.


5) Set name of the debug configuration, and fill information on Main tab.
Select Standard Create Process Launcher by clicking on the blue Select other… link at the bottom of the window.
In C/C++ Application entry fill the path to the app_process binary which is located inobj/local/armeabi/ subdirectory of your project.


6) Click on Debugger tab and fill information about debugger.
Choose gdbserver Debugger as a Debugger.
It’s good idea to set initial breakpoint to some function but Android projects do not contain main function so fill some appropriate function name in Stop on startup field (I filled Java_com_example_map_MyAndroidProject_doSomething but you can see only Java_com_exam on the screenshot).
Set path to GDB debugger. The debugger is distributed with the Android ndk. Its located at toolchains/arm-linux-androideabi-4.4.3/prebuilt/linux-x86/bin/arm-linux-androideabi-gdb.
Set path to GDB command line. This path should point to obj/local/armeabi/gdb2.setupfile inside your project. You don’t have gdb2.setup file there yet but you will create one in a while.


7) Click on the Connection tab (so you are in Debugger->Connection section of your C/C++ debug configuration) and fill information about connectinggdb with gdbserver.
Choose TCP as a type of connection and choose 5039 as a Port number.


8) Finally click Apply to save all the information about your C/C++ debug configuration.
This will save your new C/C++ debug configuration. Later, when running your application in debug mode you can choose in combo box associated with Debug button what debug configuration you want to use. Now you have two debug configurations. Android Java one which was created automatically for you when you’ve created Android project. And C/C++ one you’ve just created.

9) Go to the obj/local/armeabi/ subdirectory of your project and copygdb.setup file to gdb2.setup file. Remove target remote :5039 line fromgdb2.setup.
Eclipse don’t like target remote :5039 line in gdb setup file because it wants to enter this command internally (that is why you configured port 5039 in the previous step). Because the gdb.setup file is recreated by ndk scripts you have to copy it to the gdb2.setup and point Eclipse to the gdb2.setup file (we did this in step 6).
10) Go to the directory with Android ndk and copy ndk-gdb to ndk-gdb-eclipse. Remove execution of gdb command from ndk-gdb-eclipse.
Original content of ndk-gdb (Android NDK, r5):
578
579
580
581
if [ -n "$OPTION_EXEC" ] ; then
    cat $OPTION_EXEC >> $GDBSETUP
fi
$GDBCLIENT -x `native_path $GDBSETUP`
Content of ndk-gdb-eclipse:
578
579
580
581
if [ -n "$OPTION_EXEC" ] ; then
    cat $OPTION_EXEC >> $GDBSETUP
fi
## $GDBCLIENT -x `native_path $GDBSETUP`
Eclipse will run the gdb binary itself. So we have to remove the execution of gdb from ndk-gdb. To save original content it is good idea to copy the ndk-gdb to ndk-gdb-eclipse.
11) Now you are done. Put breakpoint in Java code after the execution ofSystem.loadLibrary() and start your application in Debug mode.
Start your application in debug mode by clicking on Debug button. It will automatically choose Android debug mode. Later you will have to take care to choose Android Java debugging configuration by clicking on combo arrow associated with the debug button.
The reason that breakpoint should be after System.loadLibrary() call is that our C/C++ code will be already loaded in that point and we can set breakpoints in it.
12) When execution reach the breakpoint run ndk-gdb-eclipse from your project directory and start debugging in C/C++ debug mode.
Go to the directory with your project and run ndk-gdb-eclipse. This will start server-part of the debugging infrastructure. Now click on the combo arrow associated with the debug button in Eclipse and choose Debug Configurations… Choose your C/C++ debug configuration and click Debug button.
The C/C++ debug configuration will be added to recently used debug configurations so later you don’t have to walk into the Debug Configurations… window again and you can choose between Android Java debug configuration and C/C++ debug configuration by just clicking on the combo arrow associated with debug button in Eclipse. However always make sure which debug configuration you are about to execute as this is where mistakes happen very often (at least for me).
After you’ve started C/C++ debug configuration click Resume button (or press F8). The application should resume its run and stop on C/C++ breakpoint (if you have one).
13) Now you are debugging the C/C++ code. Have fun!
Try to set some breakpoints in C/C++ code, etc.
Note on running ndk-gdb-eclipse
You have to run ndk-gdb-eclipse every time before starting C/C++ debug session. This script starts the gdbserver binary on device/emulator so gdb (run by Eclipse) can connect to it.
I made several attempts to force Eclipse to run ndk-gdb-eclipse script itself on start of C/C++ debug session. The most logical point is to write small script which will run ndk-gdb-eclipse without parameters (or with –force parameter) and then run gdb from Android ndk toolchain with all the parameters. This script can be used as GDB debuggercommand in the Debugger tab. But even if this script (and ndk-gdb-eclipse inside) was run successfully, the resulting connection of gdb and gdbserver always broke apart.
Final note and thanks!
This tutorial is heavily inspired by Sequoyah Project native debug tutorial. See http://www.eclipse.org/sequoyah/documentation/native_debug.php
Have Fun!